Retrieve Invoices And Manage Billing With The Chargebee Portal
11 Sep 2019
AWS Shield vs WAF – DDoS Protection For The Cloud
27 Sep 2019
In previous post, we have discussed the differences between CloudTrail and AWS Config and that has served to raise the equally pertinent question: how you compare CloudTrail to CloudWatch?
What is CloudWatch?
AWS CloudWatch is a suite of monitoring tools built into one AWS service. In this post, we’ll explore each major component of CloudWatch and explain why one would consume the Metrics, Alarms, Logs, and Events available within this useful service. Before we explore the many faces of CloudWatch, let’s find out more about CloudTrail.
What is AWS CloudTrail?
AWS CloudTrail is a log of every single API call that has taken place inside your Amazon environment. Each call is considered an event and is written in batches to an S3 bucket. These Cloudtrail events show us details of the request, the response, the identity of the user making the request, and whether the API calls came from the AWS Console, CLI, some third-party application or other AWS Service.
The Difference between CloudWatch and CloudTrail
CloudWatch focuses on the activity of AWS services and resources, reporting on their health and performance. On the other hand, CloudTrail is a log of all actions that have taken place inside your AWS environment.
How Can I Track And React To CloudTrail Events In Real Time?
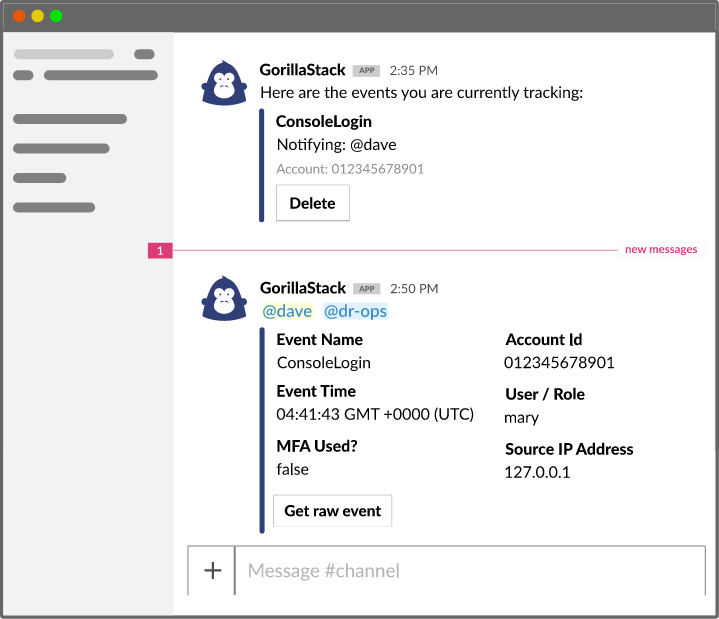
Making the most of CloudTrail events can be challenging given their breadth and depth. Often, it can involve inspecting logs a long time after an incident has been brought to your attention at which point it may be too late to remediate. With GorillaStack Real Time events, you can easily react to your most important events in near real-time.
- Sign up for GorillaStack Real Time Events
- Connect to your AWS account.
- When installation is complete, go to Templates at the top menu.
- Select which events you want to monitor.
- Notify yourself, a channel or another team member on the occurrence of any event that you’re tracking.
How do your CloudTrail events get captured?
The process is fairly simple to break down:
- Enable CloudTrail. (We recommend doing so within your AWS Organization, such that all accounts and regions are tracked centrally).
- As part of enabling CloudTrail, you will nominate an S3 bucket to store events.
- Activities occur within your environment (can be “Data Events” – operations on or within a resource, or “Management Events” – Configuration or security changes).
- The activity is captured by CloudTrail, which emits an event on the CloudWatch Events Bus.
- CloudTrail delivers the activity data to the nominated S3 Bucket in batches.
What does CloudTrail log?
Typically, CloudTrail logs a whole bunch of metadata about the API call that takes place, and that metadata tends to vary quite significantly from service to service. At a foundational level, CloudTrail will capture the following:
CloudTrail Schema
type – what type of userIdentity triggered the event (i.e. was it an IAM User), Root, another AWS Service etc
userIdentity – includes the ARN of the user or role that generated the request
eventSource – the service that the request was made to
eventTime – the time when the event took place
awsRegion – which region the event took place in
eventName – what the event actually was
sourceIPAddress – which IP Address the request was made from
userAgent – how the call was made (i.e. SDK, CLI, Console)
errorCode – if any errors occurred
errorMessage – more details on any errors
requestParameters – any parameters from the request; these vary per service and per API endpoint
responseElements – the response for any action that makes a change; these also vary on a service by service basis
additionalEventData – any further data about the event
requestID – a value that identifies the specific request; this is generated by the service itself
eventID – different from the requestID; this is generated by CloudTrail as a unique ID for each single event
eventType – tells you if it was an AwsApiCall that generated the event, an AwsServiceEvent generated by a service or if it was generated by an IAM user
apiVersion – if there was an AwsApiCall that generated the event, this will tell you the API apiVersion
managementEvent – was this a management event?
readOnly – was the operation read only?
resources – any resources that were connected to the event; the details can include ARNs, Account IDs connected to the resource owner and other identifiers
recipientAccountId – the account that received the event
serviceEventDetails – can contain data about the event trigger and its result
sharedEventID – if a CloudTrail event is delivered to multiple accounts this will show as a unique way of associating the data between those accounts
vpcEndpointId – the VPC endpoint if requests were made from a VPC to a different AWS service
How often does CloudTrail Update?
As a general rule, CloudTrail will deliver any event within about 15 minutes of the API call. CloudTrail will typically write logs to the allocated S3 bucket in batches every five minutes.
Are there quicker ways to get CloudTrail events?
Actually yes, you can get notified of specific CloudTrail events immediately by consuming them via the CloudWatch Event Bus.
While CloudTrail only writes to your S3 bucket once every five minutes, it emits events on the CloudWatch Event bus as these API calls are observed. The result is a near real-time stream of information about changes in your AWS Accounts.
GorillaStack actually uses the CloudWatch Event bus to monitor CloudTrail in our popular Real Time Events tool and can alert you to any CloudTrail event in real time. You can consume these events as alerts via Chat or Email or use them to trigger Lambda functions.
This brings us to CloudWatch Events.
What are CloudWatch Metrics?
CloudWatch Metrics are time series performance data about your AWS services and resources. These metrics mostly relate to application performance and resource utilization.
Since each CloudWatch Metric is time-stamped, you can continually monitor and review data points in relation to a particular application or overall set of applications and resources. This, in turn, allows you to build up a picture of your overall operational health. If you’d like to, set alarms when the performance falls out of an expected range or band.
How do CloudWatch Alarms work?
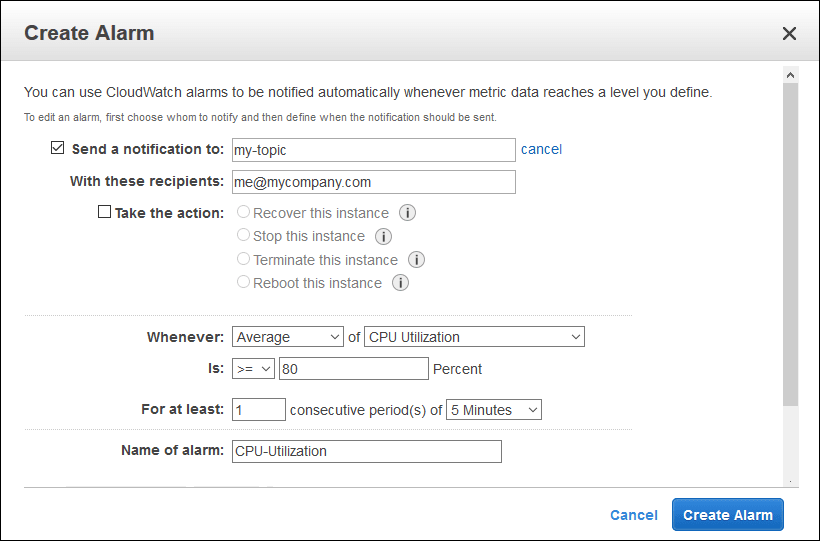
A CloudWatch Alarm can be set to trigger based on the change in state or threshold of one or more CloudWatch Metrics. You can configure the CloudWatch Alarm to evaluate a combination of metrics by applying math or percentile-based expressions. For instance, you can use up to 10 CloudWatch Metrics to build math expressions as long as those CloudWatch Metrics are covering the same period.
How do you use CloudWatch Alarms?
- You can add them to a CloudWatch dashboard and monitor them visually
- You can perform an EC2 action (as long as the Alarm isn’t a result of a math expression)
- You can perform an Auto Scaling action
- You can send alarm data over an SNS topic when the Alarm state changes
- You can then use that notification on the SNS Topic to trigger a Lambda Function
How many CloudWatch Alarms can you have in the same account?
Depending on your needs, you can set up to 5000 CloudWatch Alarms per region per account that should be plenty to get some consequential outcomes.
How often do CloudWatch Alarms update?
CloudWatch alarms update in near enough real time which is what can often make them a preferable alternative to CloudTrail if your use cases demand it.
CloudWatch Logs
AWS CloudWatch Logs is a place to store, access and monitor logs that come from AWS Services, customer application code and other sources. In addition, CloudWatch logs allow customers to centralize their logs, retain them and then analyze/access them off one scalable platform.
The best way to explain CloudWatch Logs is through example. Here are some resources and how the type of data that they write to CloudWatch:
| Service | How CloudWatch Logs is Utilized |
|---|---|
| AWS EC2 | Customers use the unified logging agent to automatically write logs from their EC2 instances to CloudWatch Logs. |
| AWS Glue | The output from the execution of AWS Glue crawlers is written to AWS CloudWatch Logs by default. This is a great example of how CloudWatch Logs can give an AWS Customer visibility into the operation of an AWS managed service. |
| AWS Lambda | All standard output and error from the execution of Lambda functions is written to CloudWatch Log Streams for a CloudWatch Log Group named after the given function. By default, Lambda will write log entries at the start and end of the Lambda execution with information about the request id, time, maximum memory used vs memory size, duration of the execution and the billing duration. |
| AWS Route 53 | Customers can log DNS queries received by Route 53. The domain or subdomain that was requested, date and time of the request, the DNS record type (such as A or AAAA), Route 53 edge location that responded to the DNS query and the DNS response code (NoError, ServFail). |
One way of leveraging all this information is to query your CloudTrail logs with Athena.
Watch on demand webinar: Actionable Security Insights Using CloudTrail & Athena
CloudTrail vs CloudWatch – A Breakdown
Below describes the key differences between CloudWatch and CloudTrail.
| Detail | CloudTrail | CloudWatch Events | CloudWatch Metrics | CloudWatch Alarms | CloudWatch Logs |
|---|---|---|---|---|---|
| Description | Audit log of AWS API calls | Near real-time feed of operational events within the AWS Environment (including CloudTrail Events) | Time-series performance data about AWS resources and user applications | Alerts fired off state changes on percentile or math based expressions of Metric data | A centralized location to store, access and monitor logs from AWS resources, managed services and application code |
| Currency of data | Updates around every 15 minutes | Updates in near real-time | Generated periodically, frequency depends on service and some configuration options | Updates off changes in Metrics | Updates in near real-time |
| Free Tier | View, filter and download 90 days of management events. Can create one trail and get management events for free, but pay for data events. S3 costs apply. | All non-custom events | Basic (5-minute frequency) monitoring metrics, 10 Detailed (1-minute frequency) monitoring metrics, 1 million API requests (not including GetMetricData and GetMetricWidgetImage) | 10 Metric Alarms (not including high resolution alarms) | 5GB Data (ingestion, archive storage, and data scanned by Logs Insights queries) |
| Costs (us-east-1 as of 19 September 2019) | Management Events: one copy free per region. For additional copies, $2.00 per 100,000. Data Events: $0.10 per 100,000 | Custom Events: $1.00/million events, Cross-Account Events: $1.00/million events | Depending on number of Metrics: $0.30-$0.02/metric/month. Detailed monitoring $2.10-$0.14/instance/month. | $0.10 per alarm metric for Standard Resolution, $0.30 per alarm metric for High Resolution | Data Ingestion: $0.50/GB, Data Storage: $0.30/GB, Log Insights: $0.005/GB Scanned |
| Uses | Audit AWS Changes | Track operational changes to AWS in real-time | Monitoring performance of resources and applications | Alerting off changes to metrics | Centralized logging |
If you’d like to track your most important CloudTrail Events and invoke real-time alerts and remediation for them, check out GorillaStack’s Real Time Events product. Book a demo with us to learn how you can use Real-Time Events for your business.

